
We've updated the Overview to show the latest sensor readings
The Overview groups sensors across all your systems, and shows you a summary of their status. Up to now, there have been 3 different views,
- Conditions - which showed unacknowledged alarm and warning notifications,
- Legionella - which uses yesterday's data to monitor legionella compliance,
- Utilities - which has sub categories for Electricity, Gas, and Water consumption and production.
Today, we've renamed the Conditions view as Notification Status to better reflect what it shows, and we've added a new view - which we've called Conditions.
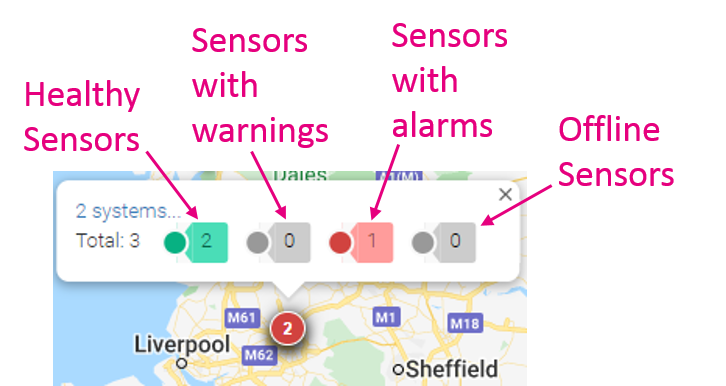
The new Overview Conditions view shows the number of conditions sensors (things like temperature, humidity, and status) in each of the following 4 states, just like the condition dashboard screen.
- Healthy - the latest sensor reading did not violate any alarm thresholds
- Warning - the latest sensor reading was between the warning and alarm thresholds
- Alarm - the latest sensor reading exceeded the alarm threshold
- Offline - the sensor has not reported any data for longer than the system's offline alert delay
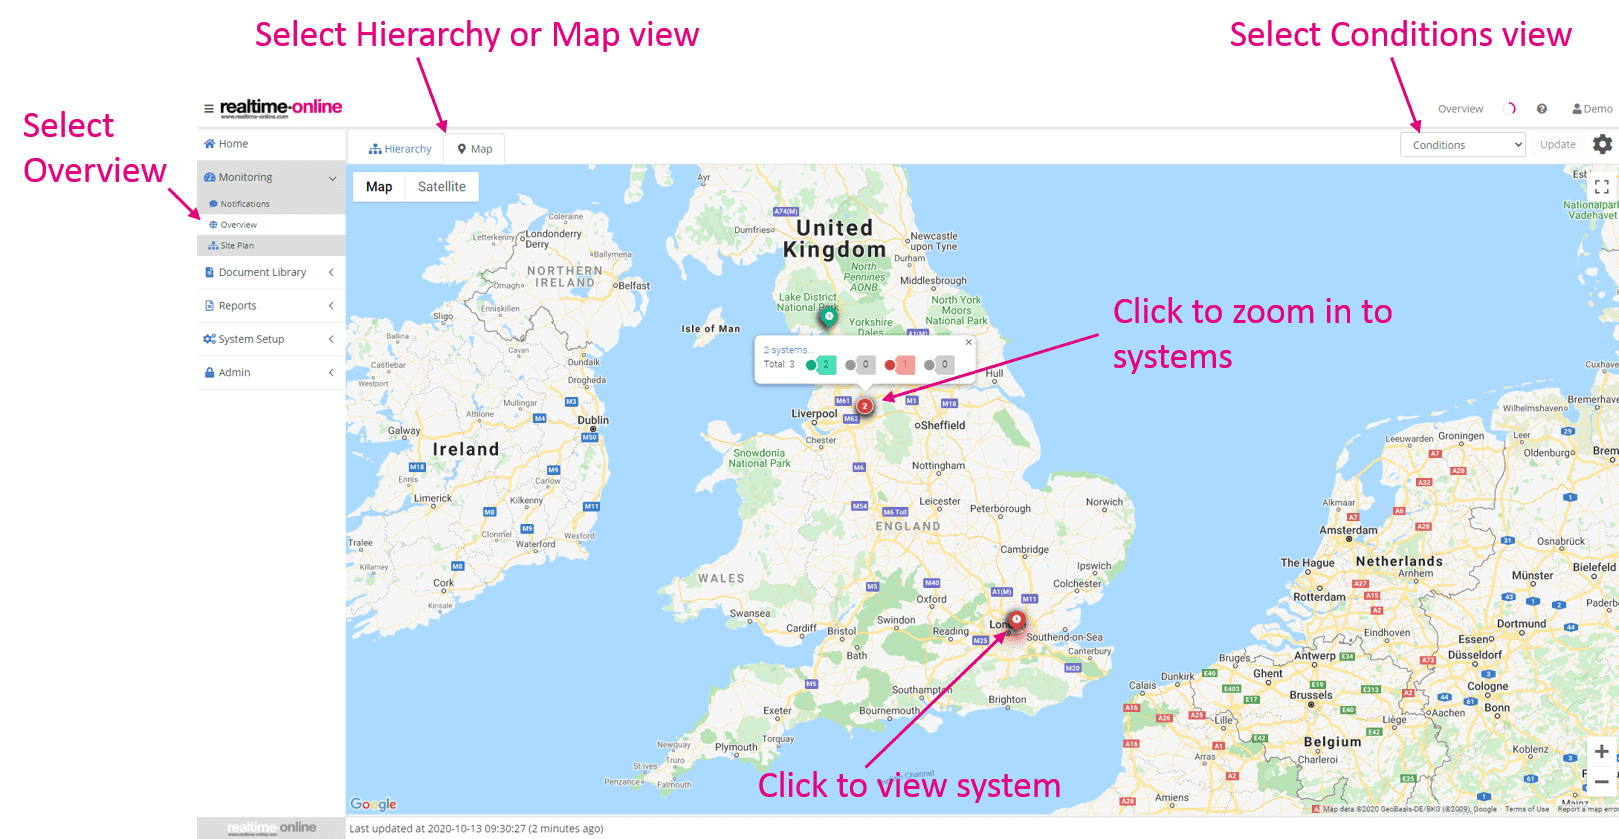
The Map view shows a geographical representation of your systems showing the latest status of your systems, so you can take action even before alarms are raised.
Organisation managers can now use Conditions to check the real time status of their estate, while using Notification Status to ensure that alarms and warnings are actioned appropriately.
Organisation managers can now use Conditions to check the real time status of their estate, while using Notification Status to ensure that alarms and warnings are actioned appropriately.